29 July 2026
Why swell forecasts don't predict the waves at Trestraou
The origin story of HappySession
Why I built HappySession, through one concrete example: Trestraou. Three ways to forecast a surf session, and why the two obvious ones weren't enough.
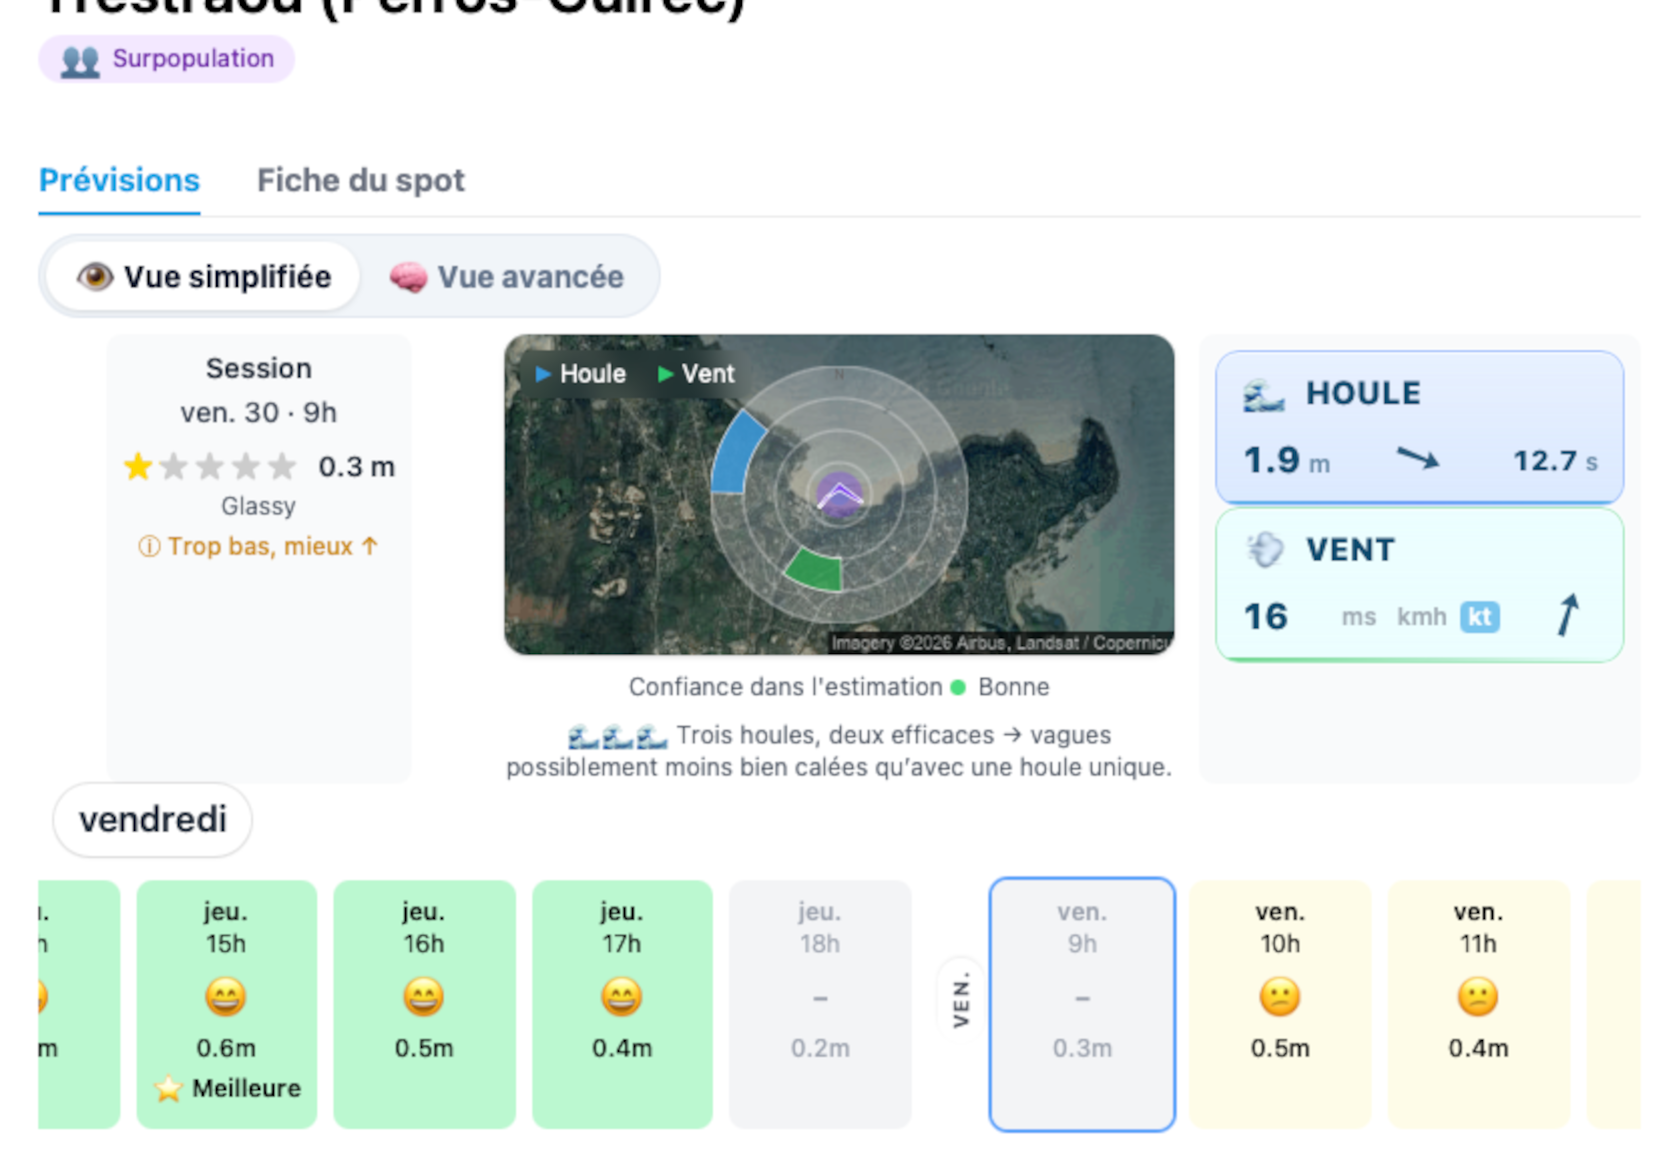
The Trestraou forecast card in HappySession: swell, wind, and estimate confidence, computed for this exact spot.
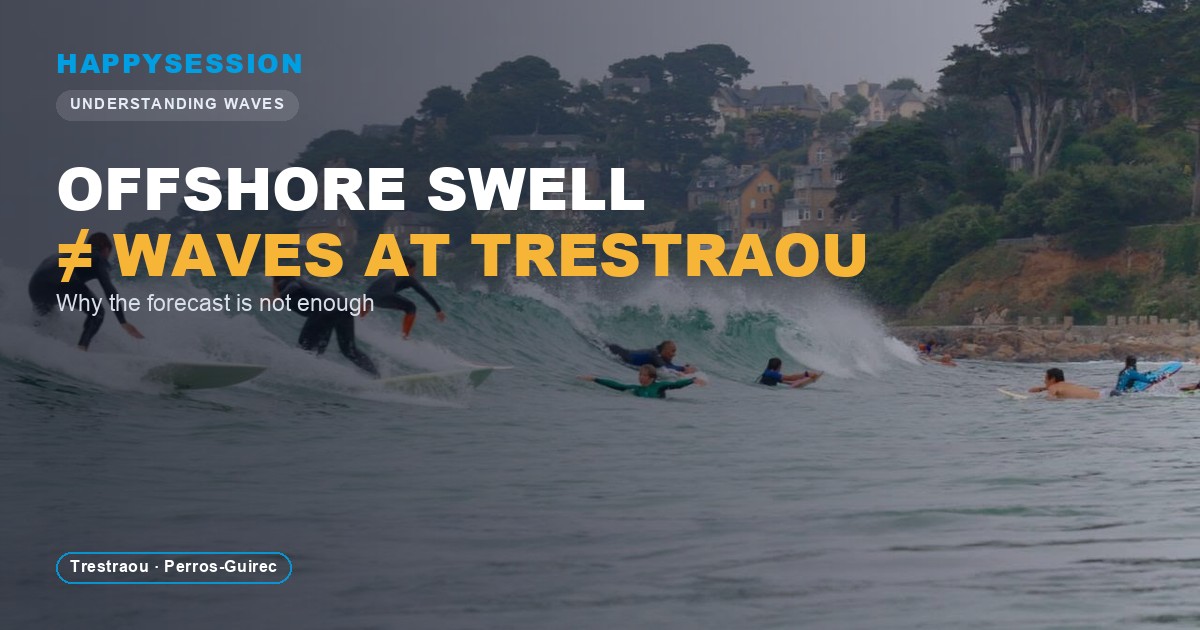
At Trestraou, the exact same forecast can produce two completely different sessions.
On paper, this large beach in Perros-Guirec should be fairly easy to forecast: it faces north, and its sandbanks aren't anything unusual. In practice, though, wave size and quality can shift fast. All it takes is a change in water depth, the tide rising instead of falling, the swell arriving from a slightly different angle, or two swells crossing each other.
Two surfers can look at the exact same numbers and come away with opposite experiences, just because they paddled out at different times.
That gap between the forecast on screen and what I actually saw in the water is what led me to build HappySession.
The problem wasn't a lack of data — plenty exists, much of it public. The real challenge was turning it into a simple answer to the question that actually matters to a surfer: is now a good time to go out?
Three approaches could answer that.
1. Read the offshore swell forecast
This is what most forecast sites do, Windguru included: they show you the raw output of a model computed offshore —
- swell height;
- period, meaning the time between two waves;
- direction.
That's useful, but it doesn't describe the waves that will actually break on the beach. It's a bit like knowing a car's speed as it enters a town without accounting for the turns, the traffic lights, or the traffic itself: the number is accurate, but it won't tell you the arrival time.
Between the open sea and Trestraou, the swell runs into the seabed, the coastline, the local wind, and the tide. All of it reshapes the swell.
At Trestraou, tide water level especially plays a major role. The spot doesn't work the same way at low, mid, or high tide. The tidal range — the height difference between low and high tide — matters too. And the wind you actually feel on the beach can differ from what's forecast further out.
So the number an ocean model shows you isn't wrong. It just answers a different question: what's the swell doing offshore? It doesn't tell you directly how big the waves will be at the peak.
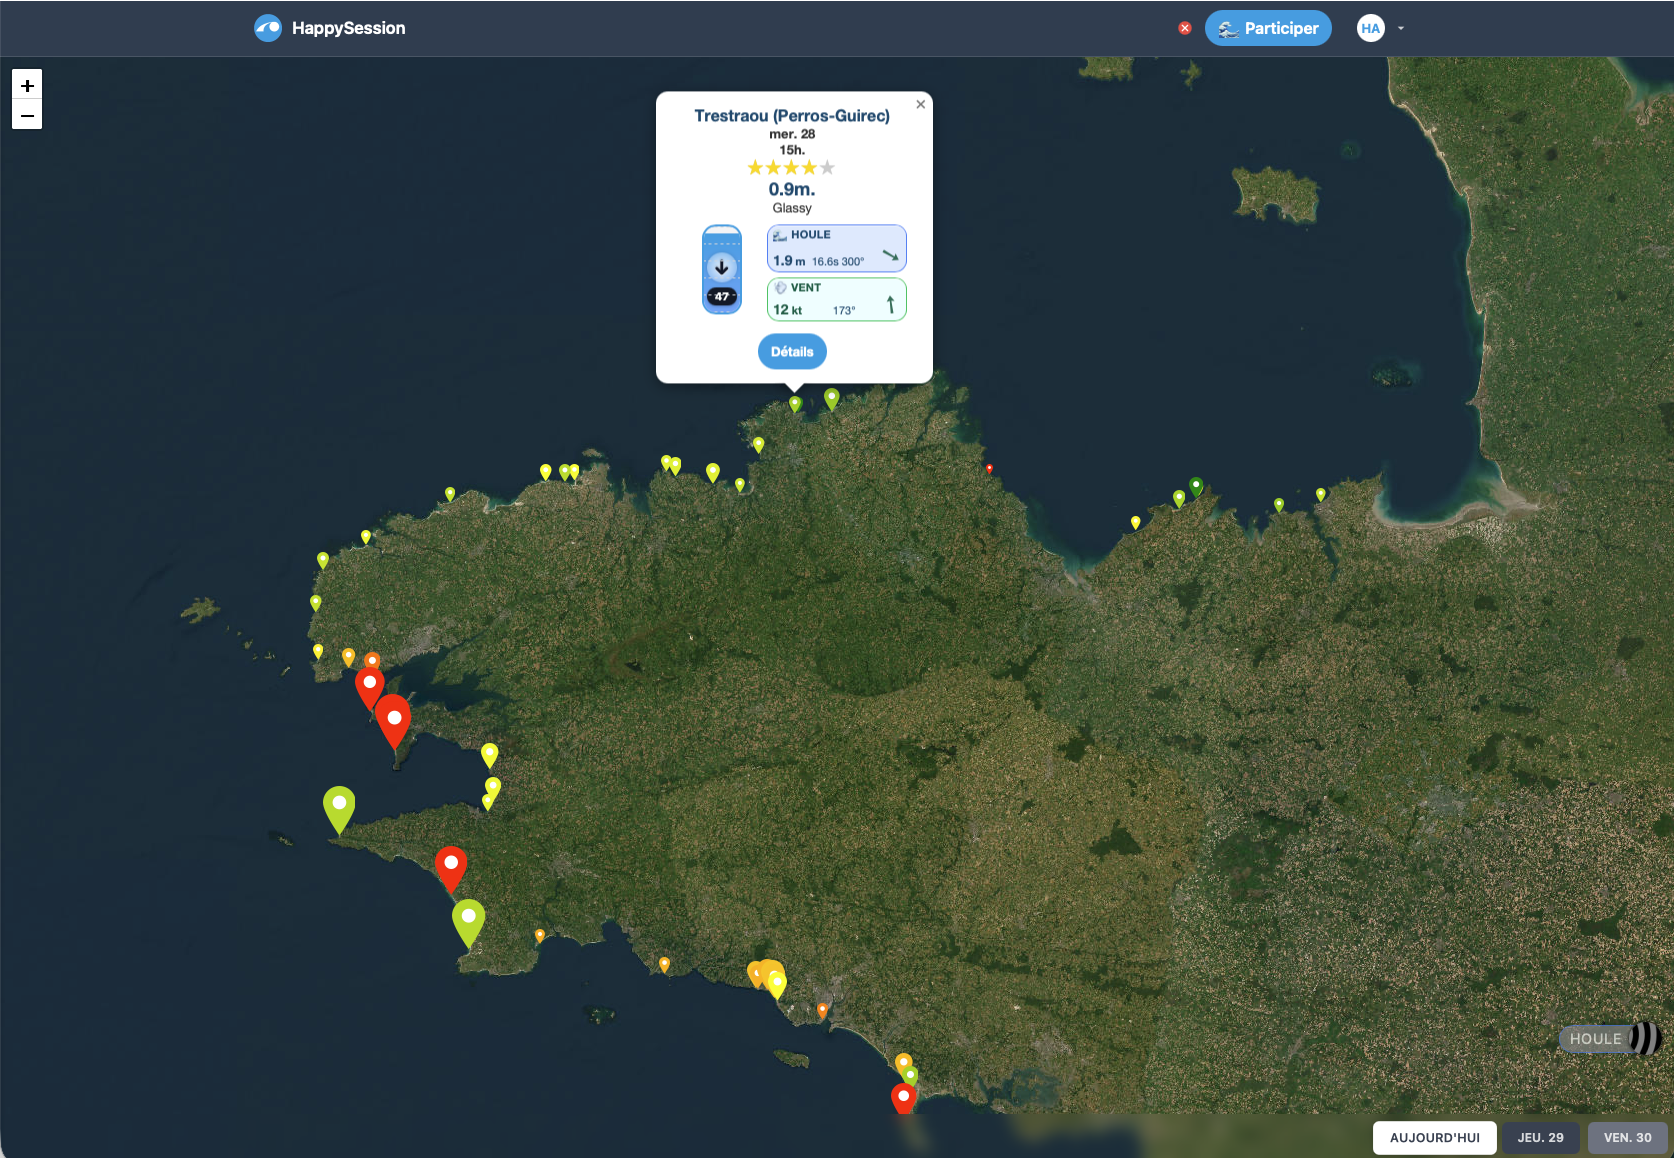
The HappySession map, with Trestraou's detail among the spots tracked across Brittany.
2. Simulate the swell's journey to the beach
The second approach is to reproduce wave physics as faithfully as possible.
As a swell approaches the coast, the seabed gets shallower. It slows down, sometimes changes direction, focuses or loses energy, and eventually breaks. A numerical model can simulate these transformations from a precise map of the seafloor.
Several specialized tools exist. WAVEWATCH III (WW3), originally developed by NOAA in the US, can model waves at large scale as well as on finer coastal grids.
In France, SHOM and Météo-France run high-resolution coastal versions of WW3. Other tools, like CRESTp — also developed by SHOM — propagate the swell toward the coast based on the shape of the seabed. None of these models, on its own, gives an exact reading of the waves that will break on a specific sandbank at a specific time.
This approach is the most rigorous, but it demands serious resources:
- detailed bathymetry, meaning a precise depth map;
- settings tuned to each specific area;
- enough compute power to rerun simulations as forecasts and tides change.
Specialized agencies have the data, the expertise, and the infrastructure to run this kind of model. For an independent project that needs to cover many spots, reproducing that setup at scale is, in practice, out of reach.
Physical simulation, then, is excellent for studying specific areas in depth, but hard to scale alone with limited time and budget.
3. Turn surfer experience into rules
For HappySession, I chose a third path: use the available data without trying to simulate the full physics.
The system starts from the offshore swell, the wind, the tide, and the tidal range. It then applies rules drawn from real-world experience. For example:
If the swell comes from this direction, with this water depth and this wind, then the spot is likely to work in this particular way.
A single rule obviously isn't enough. It's their combination that produces a forecast tailored to the spot.
This method has a name: rule-based inference. It belongs to a historic branch of artificial intelligence — the "expert systems" that appeared long before the current rise of machine learning. Instead of learning on its own from thousands of examples, the machine applies logic explicitly written from human knowledge.
This approach doesn't reproduce every physical transformation of the swell. But it has three key advantages:
- it can be tailored to each spot's quirks;
- it focuses on the factors that actually matter for deciding whether to go surf;
- it improves as real-world observations come in.
That trade-off is what gave birth to HappySession: connecting available data to the real experience of the spot, to produce a forecast closer to what the surfer will actually find in the water.
What's next?
The rules engine keeps evolving. HappySession is now exploring two other forms of artificial intelligence: a model that automatically recognizes session types, and a language model that can talk with users. More than a simple agent, the latter is closer to a real surf coach: it helps people understand the forecasts and pick the best time to get in the water.
That'll be the subject of upcoming articles.
In the meantime, check the upcoming conditions at Trestraou, no account needed.
Important information
HappySession provides estimates based on available data and a surf-focused analysis. Actual conditions may differ. Every surfer remains responsible for their own safety and should always be careful.